Chapter 2 Decision Classification Boundaries
(TL;DR) Glickman, Moran, and Usher’s (2022) Decision Classification Boundaries perform (1) outstandingly well with simulated, perceptual data; (2) decently well with impatient subjects in perceptual tasks; and (3) unsurprisingly poor with subjects in value-based tasks.
This notebook is a test of the methods from (Glickman, Moran, and Usher 2022). I would like to see if their algorithm that dynamically estimates collapsing bounds (Decision Classification Boundary, DCB) works with perceptual data from an upcoming belief tracking project and value-based data from (Eum, Dolbier, and Rangel 2022).
Simulated, perceptual data
First, I will simulate data for two cyborgs using a DDM. Their task will be to select from two streams of rectangles whichever stream has the taller average height (see (Tsetsos et al. 2016) or (Glickman, Moran, and Usher 2022)). The first cyborg will utilize fixed decision boundaries; the second cyborg will utilize collapsing boundaries (Weibull function, per tradition). I will test if the DCB algorithm can recover the decision boundaries for both cyborgs.
Real, perceptual data
Second, I will use preliminary data collected for my upcoming slider task. The task is again for subjects to select from two streams of rectangles which stream has the taller average height. I think it would be interesting to see if DCB works with both (1) accumulated evidence and (2) location of the slider.
Real, value-based data
Third, I will read in the data from (Eum, Dolbier, and Rangel 2022). I will only use trials from the visible condition. This will be interesting since there isn’t a stream of varying evidence. It’s just a single value comparison that accumulates over time. If we use an aDDM, then there will be some variation in evidence over time based on fixation data.
Here’s a quick summary of what DCB does:
- Discretize your time-dimension.
- Consider a single trial. At any time during that trial, the sequence of stimuli has provided a stream of evidence in favor of one of the actions. In the case of perceptual tasks, we can take the sum of evidence over time and come up with a metric for “accumulated evidence” at any given time point. This might be a bit trickier in value-based decision tasks.
- At any given point in time, agents have three potential actions (continue sampling, choose left, choose right). If we consider one point in time, then we can look at the distributions of actions along a single dimension, accumulated evidence.
- Each trial yields one point along this accumulated evidence dimension. The points are labeled by the action taken at that time during that trial. This allows for supervised separation by linear discriminant analysis (LDA).
- The boundary separation curves approximate decision boundaries over time.

2.1 Simulated, perceptual data
2.1.1 Simulate data
The task is to select from two streams of rectangles the stream with the taller average height. We will generate two DDM cyborgs, the first with fixed decision bounds, the second with collapsing decision bounds.
DDM function
Simulate behavior for a single trial using a DDM with symmetric bounds about 0.
Input: Two equal-length streams of evidence, DDM parameters.
Output: A time-series of choice (0=R, 1=L, 2=continue) and accumulated evidence (scaled by drift since we are working with the DDM).
DDM <- function(L=c(0,0,0), R=c(0,0,0), b=0, d=.002, sig=.03, bound=c(1,1,1)) {
  if (length(L)!=length(R)) {stop("L and R differ in length.")}
  if (length(b)!=1 | length(d)!=1 | length(sig)!=1) {stop("Invalid DDM parameters.")}
  if (length(bound)!=length(L) & length(bound)!=1) {stop("Invalid bound. Must be defined at every time point or fixed.")}
  if (length(bound)==1) {ub <- rep(bound, length(L))} else {ub <- bound}
  df <- data.frame(
    sample = rep(NA, length(L)),
    choice = rep(NA, length(L)),
    ae = rep(NA, length(L))
  )
  RDV <- b
  accumEvid <- 0
  boundaryHit <- F
  for (t in 1:length(L)) {
    df$sample[t] <- t
    RDV <- RDV + d*(L[t]-R[t]) + rnorm(1, mean=0, sd=sig)
    accumEvid <- accumEvid + d*(L[t]-R[t]) # Accumulated evidence depends on the model you're using.
    df$ae[t] <- accumEvid
    df$choice[t] <- 2
    if (RDV>=ub[t] | RDV<=-ub[t]) {
      if (RDV>=ub[t]) {df$choice[t] <- 1}
      if (RDV<=-ub[t]) {df$choice[t] <- 0}
      boundaryHit <- T
      break
    }
  }
  # if (boundaryHit==F) { #Use this to figure out which trials didn't reach a decision.
  #   print("Decision was not reached within allotted number of samples.")
  # }
  return(df)
}
Trial Data
This will be exactly the same for both the fixed and collapsing cyborgs. Heights will vary around 50, bounded within (0,100). All trials will favor either L or R, but the degree of difficulty may vary.
set.seed(seed)
nSamples = 50
nTrials = 1000
byTrial.mean = 50
byTrial.sd = 20
bySample.sd = 20
lb <- 0
ub <- 100

simulateData <- function(nSamples,nTrials,byTrial.mean,byTrial.sd,bySample.sd,lb,ub) {
  simData <- data.frame(
    trial = 1,
    L = rtruncnorm(
      nSamples,
      mean = rnorm(1, mean = byTrial.mean, sd = byTrial.sd),
      sd = bySample.sd,
      a = lb,
      b = ub
    ),
    R = rtruncnorm(
      nSamples,
      mean = rnorm(1, mean = byTrial.mean, sd = byTrial.sd),
      sd = bySample.sd,
      a = lb,
      b = ub
    )
  )

  for (n in 2:nTrials) {
  #progress(n, nTrials) #progress tracker
  tempData <- data.frame(
    trial = n,
    L = rtruncnorm(
      nSamples,
      mean = rnorm(1, mean = byTrial.mean, sd = byTrial.sd),
      sd = bySample.sd,
      a = lb,
      b = ub
    ),
    R = rtruncnorm(
      nSamples,
      mean = rnorm(1, mean = byTrial.mean, sd = byTrial.sd),
      sd = bySample.sd,
      a = lb,
      b = ub
    )
  )
  simData <- rbind(simData, tempData)
  }
  return(simData)
}

simData <- simulateData(
  nSamples,
  nTrials,
  byTrial.mean,
  byTrial.sd,
  bySample.sd,
  lb,
  ub)
Fixed bounds cyborg
Bounds are fixed to 50 and -50 via the ‘bound’ attribute of the fixedCyborg.ddm object.
set.seed(seed)

fixedCyborg.ddm <- list(
  b = 0,
  d = .9,
  sig = 4,
  bound = 50
)

trialData <- list(
    L = simData$L[simData$trial==1],
    R = simData$R[simData$trial==1]
  )
fixedCyborg.data <- do.call(DDM, c(trialData,fixedCyborg.ddm))
fixedCyborg.data$trial <- 1

for (trial in 2:nTrials) {
  #progress(trial,nTrials) #progress tracker
  trialData <- list(
    L = simData$L[simData$trial==trial],
    R = simData$R[simData$trial==trial]
  )
  tempData <- do.call(DDM, c(trialData,fixedCyborg.ddm))
  tempData$trial <- trial
  fixedCyborg.data <- rbind(fixedCyborg.data, tempData)
}
fixedCyborg.data <- na.omit(fixedCyborg.data)
summary(fixedCyborg.data)
## sample choice ae trial
## Min. : 1.000 Min. :0.00 Min. :-123.9434 Min. : 1.0
## 1st Qu.: 2.000 1st Qu.:2.00 1st Qu.: -27.4550 1st Qu.: 256.0
## Median : 3.000 Median :2.00 Median : -0.1181 Median : 517.5
## Mean : 4.606 Mean :1.67 Mean : 0.2420 Mean : 508.7
## 3rd Qu.: 6.000 3rd Qu.:2.00 3rd Qu.: 28.3773 3rd Qu.: 750.8
## Max. :33.000 Max. :2.00 Max. : 134.0897 Max. :1000.0Collapsing bounds cyborg
Bounds are decreasing as a Weibull function. Weibull parameters are taken directly from (Glickman, Moran, and Usher 2022), which I’m led to believe are taken directly from (Hawkins et al. 2015). The Weibull function is taken directly from (Hawkins et al. 2015). The scale parameter (\(\lambda\)) is fixed to 4. Shape (\(\kappa\)) and asymptotic convergence (\(a'\)) can vary.
set.seed(seed)

weibullbound <- function(t, a, k, lam, ap) {
  return( a-(1-exp(-(t/k)^k))*(.5*a+ap) )
}

collapsingCyborg.ddm <- list(
  b = 0,
  d = .9,
  sig = 4,
  bound = weibullbound(t=c(1:nSamples), a=100, k=3, lam=4, ap=10) # see Glickman et al. (2022) or Hawkins et al. (2015)
)

trialData <- list(
  L = simData$L[simData$trial==1],
  R = simData$R[simData$trial==1]
)
collapsingCyborg.data <- do.call(DDM, c(trialData,collapsingCyborg.ddm))
collapsingCyborg.data$trial <- 1

for (trial in 2:nTrials) {
  #progress(trial,nTrials) #progress tracker
  trialData <- list(
    L = simData$L[simData$trial==trial],
    R = simData$R[simData$trial==trial]
  )
  tempData <- do.call(DDM, c(trialData,collapsingCyborg.ddm))
  tempData$trial <- trial
  collapsingCyborg.data <- rbind(collapsingCyborg.data, tempData)
}
collapsingCyborg.data <- na.omit(collapsingCyborg.data)
summary(collapsingCyborg.data)
## sample choice ae trial
## Min. : 1.000 Min. :0.000 Min. :-162.7401 Min. : 1.0
## 1st Qu.: 2.000 1st Qu.:2.000 1st Qu.: -29.7781 1st Qu.: 234.0
## Median : 3.000 Median :2.000 Median : 0.6016 Median : 500.0
## Mean : 3.832 Mean :1.684 Mean : 0.7965 Mean : 496.9
## 3rd Qu.: 5.000 3rd Qu.:2.000 3rd Qu.: 32.0336 3rd Qu.: 747.0
## Max. :30.000 Max. :2.000 Max. : 153.0255 Max. :1000.02.1.2 Check behavior

2.1.3 DCB
DCB function
Dynamically estimate collapsing decision boundaries up to a certain sample number.
Input: (1) Time-series data for a single subject with trial, sample number, choice ({0,1,2} see above), and accumulated evidence. (2) Maximum sample number (since our figures only go up to 10, let’s just set this as 10 for now).
Output: Time-series of the bound, over sample number dimension (time). Note that (Glickman, Moran, and Usher 2022) assumed that the collapsing bounds were symmetrical, therefore they took the average of the separating planes.
DCB <- function(data, maxSample) {
  samples <- c(1:maxSample)
  output <- data.frame(
    sample = samples,
    ub = rep(NA, length(samples)),
    lb = rep(NA, length(samples)),
    avgb = rep(NA, length(samples))
  )
  x_vals <- data.frame(ae = seq(-150,150,1)) # resolution of the collapsing boundary
  for (n in samples) { #samples
    tryCatch({ # In some cases, there may not be any decisions for left or right when sample number is small. Don't return an error.
      lda.fit <- lda(choice~ae, data[data$sample==n,])
      lda.pred <- predict(lda.fit,x_vals)
      #x_val closest to decision boundary for upper bound (.5 posterior probability of being choice=1 or 2)
      ub_x_vals <- seq(0,150,1)
      output$ub[n] = ub_x_vals[ which(abs(lda.pred$posterior[151:301,'2']-0.5)==min(abs(lda.pred$posterior[151:301,'2']-0.5))) ]
      #x_val closest to decision boundary for lower bound (.5 posterior probability of being choice=0 or 2)
      lb_x_vals <- seq(-150,-1,1)
      output$lb[n] = lb_x_vals[ which(abs(lda.pred$posterior[1:150,'2']-0.5)==min(abs(lda.pred$posterior[1:150,'2']-0.5))) ]
      output$avgb[n] = .5*(abs(output$ub[n])+abs(output$lb[n]))
    }, error=function(e){cat("ERROR :",conditionMessage(e), "\n")})
  }
  return(output)
}

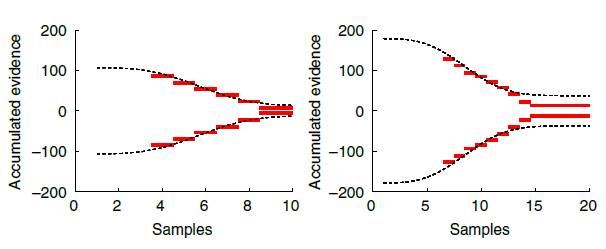
2.1.4 Preliminary conclusion
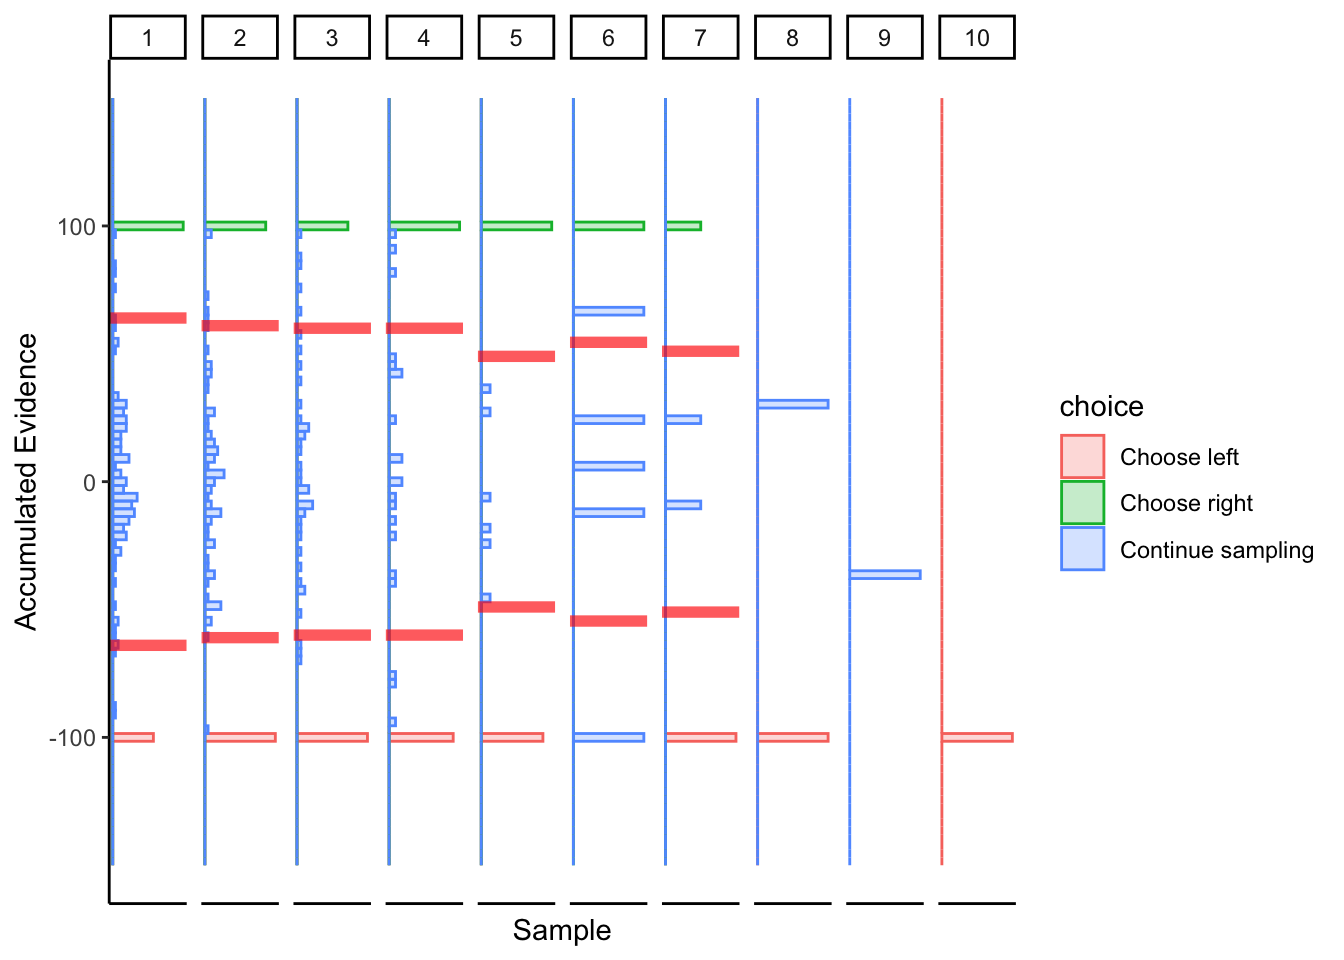
The DCB performs remarkably well for simulated, perceptual data where there are sequences of stimuli for each decision.
There is one obvious problem at this stage. Decision boundaries cannot be estimated at a given point in time if, across all trials, all three actions are not made at that point in time. For instance, at sample 1, no choices were made for the right option; therefore, decision boundaries cannot be estimated at time \(\text{sample}=1\). This prevents the DCB from estimating the starting point of decision boundaries. This seems to be the case in (Glickman, Moran, and Usher 2022) too.
2.1.5 Comparative statics
Let’s see how the DCB performs when we alter some of the cyborgs’ parameters.
2.1.5.1 Fixed bounds cyborg
Drift
Prediction: The DCB should work fine regardless of the drift rate since accumulated evidence can be modulated by drift rate. This should also extend to attentional discounting from the aDDM with fixation data.
- bias = \(0\)
- noise = \(4\)
- bound = \(\pm 50\)
## ERROR : infinite or missing values in 'x'
## ERROR : infinite or missing values in 'x'
## ERROR : infinite or missing values in 'x'
## ERROR : infinite or missing values in 'x'
Aside from the fact that all the choices are not represented at early times when drift rate is low, we see that DCB tracks the fixed boundary well for any drift rate.
Noise
This is important to consider since accumulated evidence can bleed over LDA boundaries. The more noise there is, the more that measurements of accumulated evidence will bleed over into other classifications. For instance, with a larger noise, there should be more “continue sampling” observations that fall above the separating plane for “choose left” and below the separating plane for “choose right”. And vice versa.
Prediction: I think more noise variance will negatively affect the performance of the DCB.
- bias = \(0\)
- drift = \(0.9\)
- bound = \(\pm 50\)
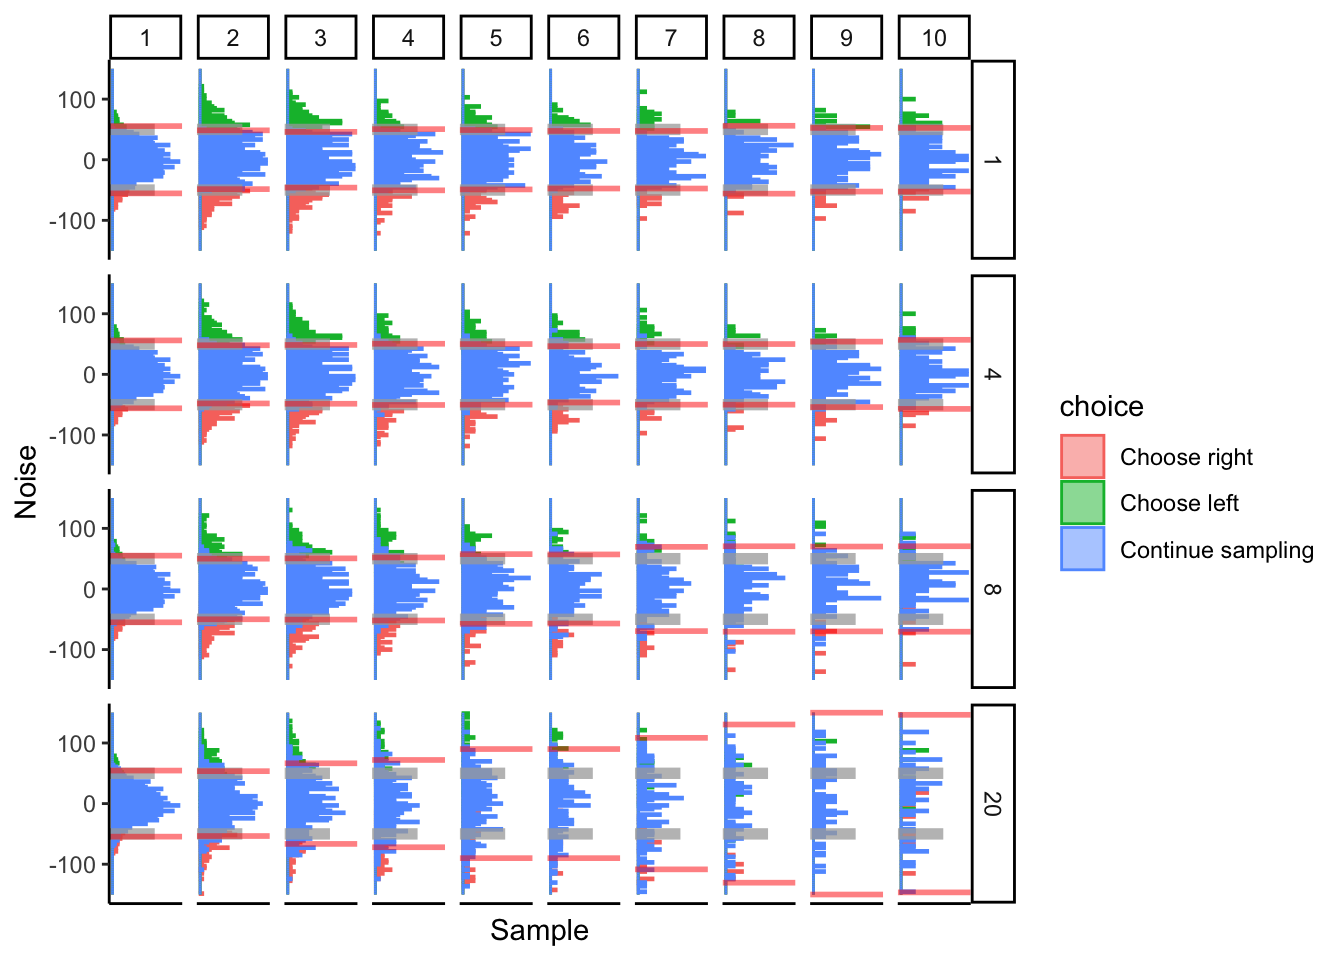
As the variance of noise grows, we see the performance of DCB progressively deteriorate over time. I would imagine that this could become a huge problem in real data and might affect the robustness of this algorithm.
Bounds
Prediction: I think this may end up mechanically similar to changing the drift rate, so I don’t think changing the bounds will affect DCB performance.
- bias = \(0\)
- drift = \(0.9\)
- noise = \(4\)
## ERROR : infinite or missing values in 'x'
Bounds don’t seem to affect the performance of the DCB. The relatively poor performance of the DCB when bounds are large is caused by the uneven distribution of choices at early times. Early times are dominated by “continue sampling”, making it difficult for LDA to determine accurate classification bounds.
Number of trials
Keeping all else constant, how does the DCB perform with varying numbers of trials.
Prediction: DCB performance will asymptotically converge to some maximum performance. Hopefully it works well for approximately 300 trials, since I would like to apply this algorithm to more than simulated data.
- bias = \(0\)
- drift = \(0.9\)
- noise = \(4\)
- bound = \(\pm 50\)
## ERROR : infinite or missing values in 'x'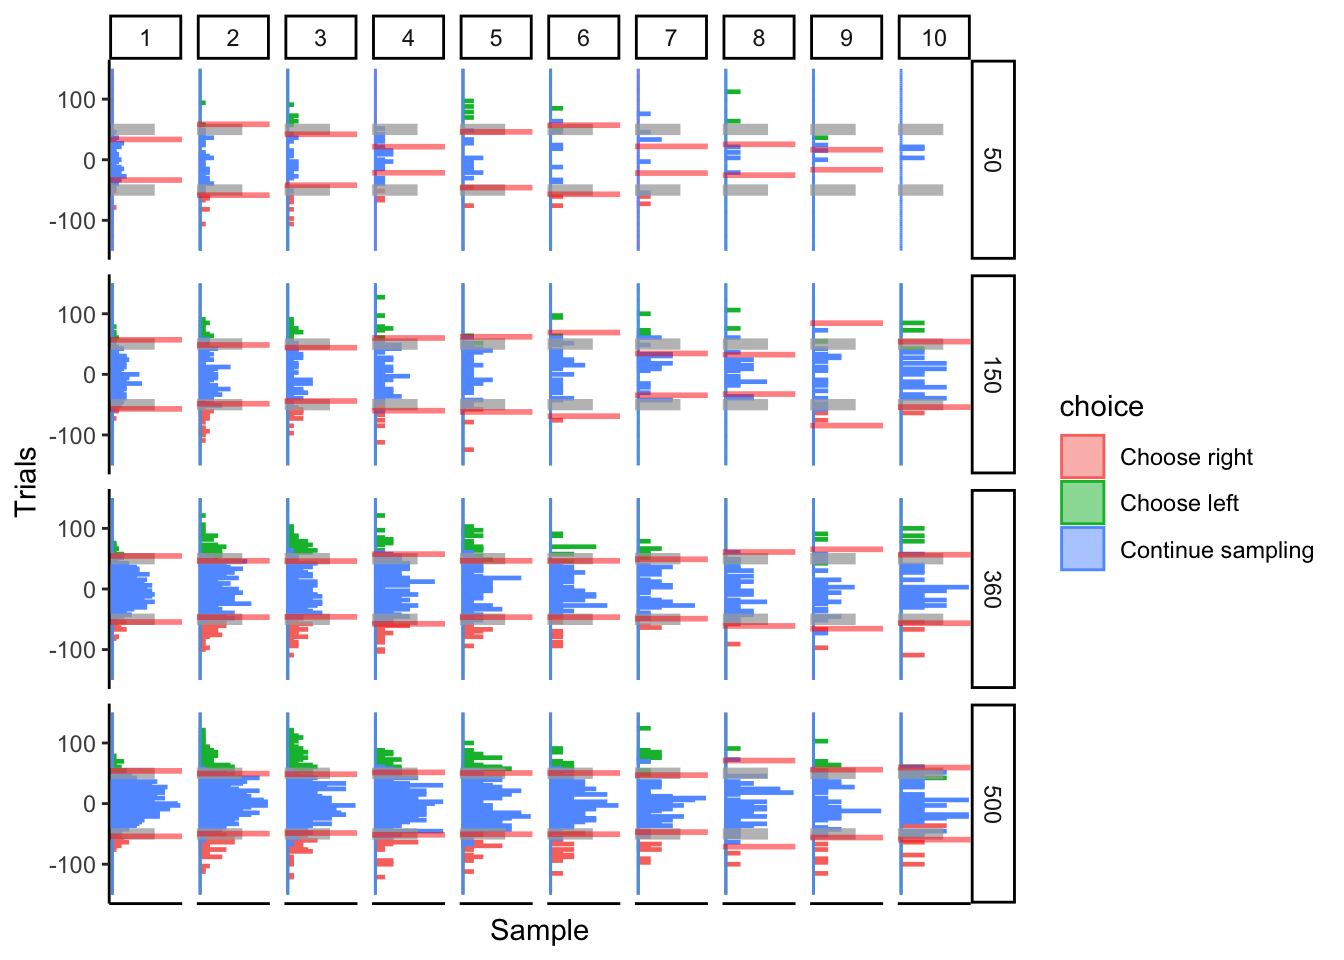
The DCB performs ok at 150 trials. By 360 trials, it looks like it is fitting fixed bounds decently. Not too much performance improvement from 360 to 500 trials. I think this ultimately depends on how many choices are made at every time point, which may or may not be dependent on the total number of trials.
2.1.5.2 Collapsing bounds cyborg
Drift
So far, our cyborgs are just linear accumulators since drift rate has been set to 1 for the cyborgs. This is a special case of the DDM, but does the DCB still work for other drift rates?
Prediction: The DCB should work fine regardless of the drift rate. We just need to account for the drift rate in our accumulated evidence. This should also extend to attentional discounting from the aDDM, so long as we use fixation data.
- bias = \(0\)
- noise = \(4\)
- Weibull scale = \(4\)
- Weibull shape = \(3\)
- Weibull asymptote = \(10\)
## ERROR : infinite or missing values in 'x'
## ERROR : infinite or missing values in 'x'
## ERROR : infinite or missing values in 'x'
## ERROR : infinite or missing values in 'x'
## ERROR : infinite or missing values in 'x'
## ERROR : infinite or missing values in 'x'
## ERROR : infinite or missing values in 'x'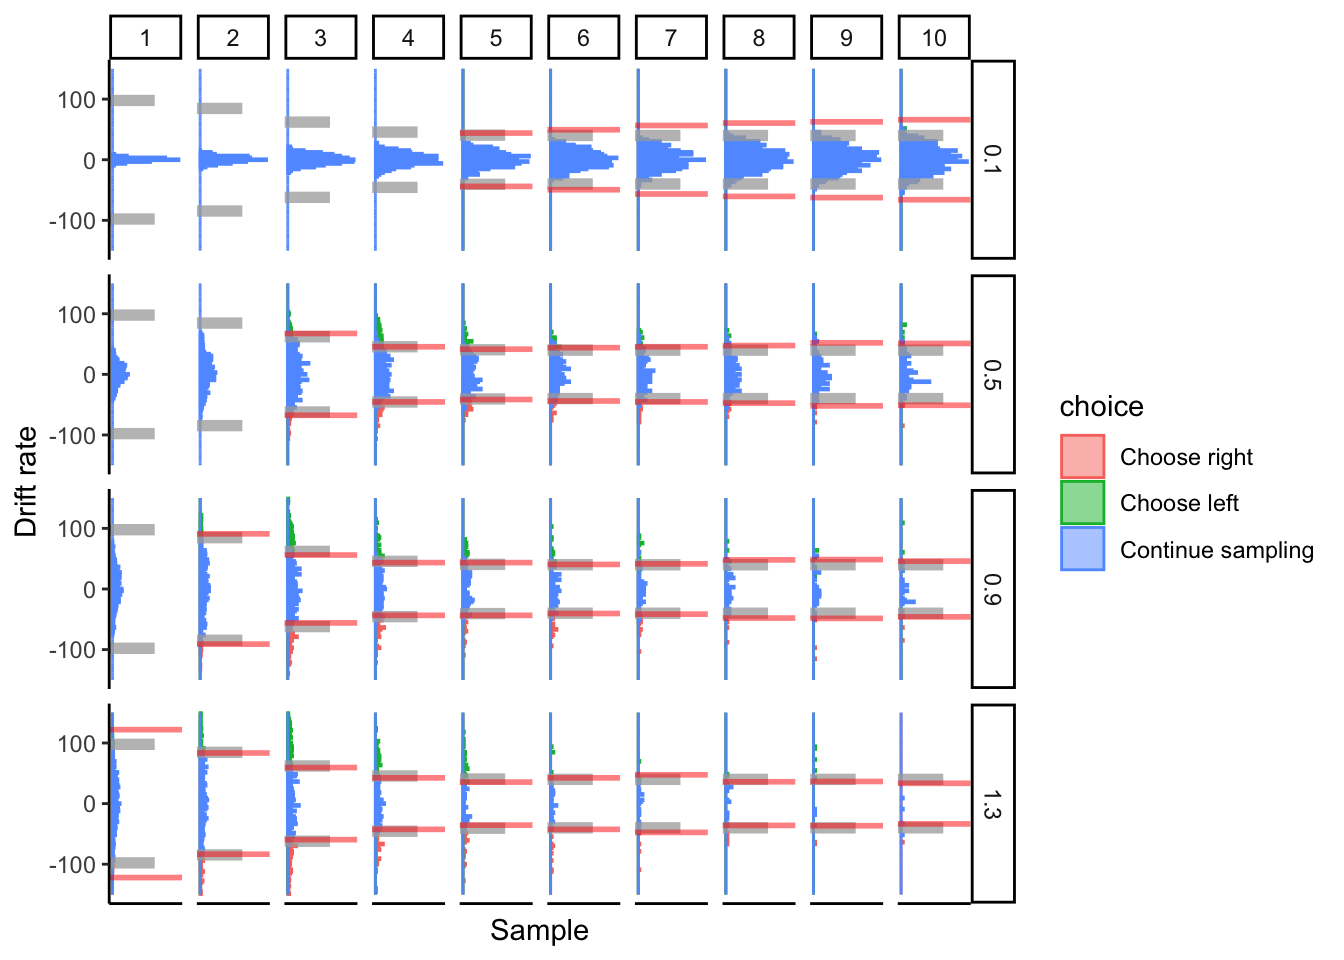
At low drift rates, the DCB fails to capture the asymptote of the collapsed bounds. Otherwise, it performs fine.
Noise
This is important to consider since accumulated evidence can bleed over LDA boundaries. The more noise there is, the more that measurements of accumulated evidence will bleed over into other classifications. For instance, with a larger noise, there should be more “continue sampling” observations that fall above the separating plane for “choose left” and below the separating plane for “choose right”. And vice versa.
- bias = \(0\)
- drift = \(0.9\)
- Weibull scale = \(4\)
- Weibull shape = \(3\)
- Weibull asymptote = \(10\)
## ERROR : infinite or missing values in 'x'
## ERROR : infinite or missing values in 'x'
## ERROR : infinite or missing values in 'x'
Again, performance degrades over time when noise is large. It almost looks like the boundaries collapse, then widen again. At absurdly large amounts of noise, we even see it widen, tighten, widen, and tighten (all within 10 samples!). I bet we’ll see patterns like this in real data.
Weibull Shape
Change the shape of the Weibull collapsing function. The larger the shape, the later the collapse.
- bias = \(0\)
- drift = \(0.9\)
- noise = \(4\)
- Weibull scale = \(4\)
- Weibull asymptote = \(10\)
## ERROR : infinite or missing values in 'x'
## ERROR : infinite or missing values in 'x'
## ERROR : infinite or missing values in 'x'
## ERROR : infinite or missing values in 'x'
The DCB tracks the time of collapse well.
Weibull Asymptote
The Weibull collapsing function starts at \(a=100\). It will converge to \(0.5a+a'\). We are adjusting \(a'\). Dropping from \(a'>0\) to \(a'=0\) asymptotically brings us down to a bound of 50. \(a'<0\) drags the asymptote below 50.
- bias = \(0\)
- drift = \(0.9\)
- noise = \(4\)
- Weibull scale = \(4\)
- Weibull shape = \(3\)
## ERROR : infinite or missing values in 'x'
## ERROR : infinite or missing values in 'x'
## ERROR : infinite or missing values in 'x'
## ERROR : infinite or missing values in 'x'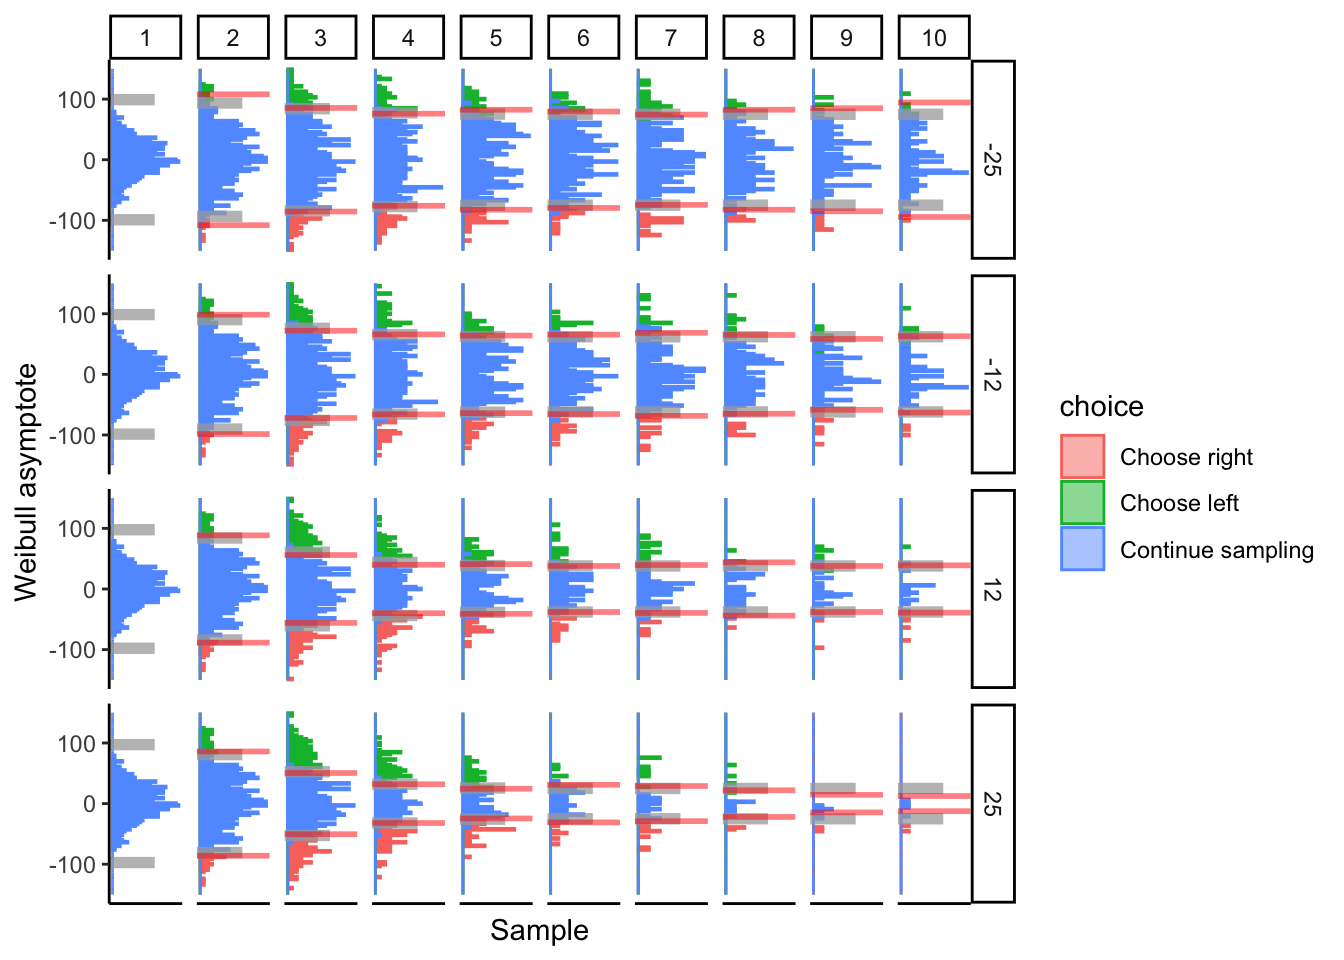
The DCB tracks the asymptote of collapse well.
Number of trials
Keeping all else constant, how does the DCB perform with varying numbers of trials.
- bias = \(0\)
- drift = \(0.9\)
- noise = \(4\)
- bound = \(\pm 50\)
## ERROR : infinite or missing values in 'x'
## ERROR : infinite or missing values in 'x'
## ERROR : infinite or missing values in 'x'
## ERROR : infinite or missing values in 'x'
## ERROR : infinite or missing values in 'x'
## ERROR : infinite or missing values in 'x'
## ERROR : infinite or missing values in 'x'
Performance seems sufficient at 150 trials, and improves (with diminishing returns) at larger trial counts.
2.1.6 Conclusion
Looks like DCB might work for tasks with sequential presentation and comparison of multiple stimuli, particularly in the perception and numerosity domains.
Need to make sure that the variance of noise is not too large amongst subjects, otherwise DCB will likely fail to track decision boundaries. This may be partially controlled by the noisiness of stimuli. For instance, displaying streams of numbers might result in less noise than displaying streams of collections of balls (where the collections represent a number).
DCB might work in as little as 150 trials per subject, though more trials only aids with accuracy. It’s performance is more dependent on drift (since we need a decent distribution across all choices at a given time) and noise (since accumulated evidence can bleed over decision boundaries).
2.2 Perceptual data, DDM
We use data from a study currently in progress. I can’t share this data yet since the project is still at an early phase. Subjects simultaneously view two streams of rectangles and are asked to choose which stream has the larger average as quickly as possible (see (Tsetsos et al. 2016)).
2.2.1 Prep work
Read-in and clean data
Reads in data and outputs a time-series of accumulated evidence and choices (along with slider location, etc.). Choices are 0=left, 1=right, 2=continue sampling.
slider.data <-
  read.csv("data/dcb-all_dataSlider.csv")
slider.data <- data.frame(
  subject=factor(slider.data$participant),
  trial=slider.data$block.thisN*120 + slider.data$trial.thisN,
  sample=slider.data$samplePhase.thisN,
  choice=slider.data$choice,
  evidence=round((slider.data$heightR-slider.data$heightL)*100,2),
  sliderLoc=(slider.data$sliderLoc*2-1)*100,
  time=round(slider.data$sliderTime,3)*1000
)

slider.data <- slider.data %>%
  group_by(subject,trial,sample) %>%
  summarize(
    choice=last(choice),
    evidence=last(evidence),
    sliderLoc=last(sliderLoc),
    time=last(time)
  ) %>%
  ungroup() %>%
  group_by(subject,trial) %>%
  mutate(
    ae=cumsum(evidence),
    samples=max(sample)
  )
## `summarise()` has grouped output by 'subject', 'trial'. You can override
## using the `.groups` argument.Take subj data, output figure
Time dimension is along number of samples. Note that time-steps are not consistent since each pair of stimuli are displayed for a variable amount of time.
plotDCB <- function(data, maxSamples=10) {
  # Get subject's data and convert it to useable input to our DCB() function.
  # Requires sample, choice, ae, and trial variables in time-series panel format.
  subj.data <- data
  subj.data <- subj.data[,c('sample','choice','ae','trial')]

  # DCB
  subj.dcb <- DCB(subj.data, maxSamples)
  subj.dcb

  tempData <- subj.data
  tempData$choice <- factor(tempData$choice, levels=c(0,1,2), labels=c('Choose left','Choose right','Continue sampling'))
  tempData <- merge(tempData,subj.dcb[,c('sample','avgb')], by.x="sample", by.y="sample")
  p <- tempData[tempData$sample<=maxSamples,] %>%
    ggplot(aes(x=ae, fill=choice, color=choice)) +
    geom_histogram(alpha=.25, bins=100, position='identity') +
    geom_vline(aes(xintercept=avgb), color='red', alpha=.65, size=2) +
    geom_vline(aes(xintercept=-avgb), color='red', alpha=.65, size=2) +
    coord_flip() +
    theme_classic() +
    labs(x='Accumulated Evidence', y='Sample') +
    xlim(c(-150,150)) +
    theme(
      plot.title = element_text(size=22),
      axis.ticks.x = element_blank(),
      axis.text.x = element_blank()
    ) +
    facet_grid(~sample, scales="free")
  return(p)
}
2.2.2 DCB
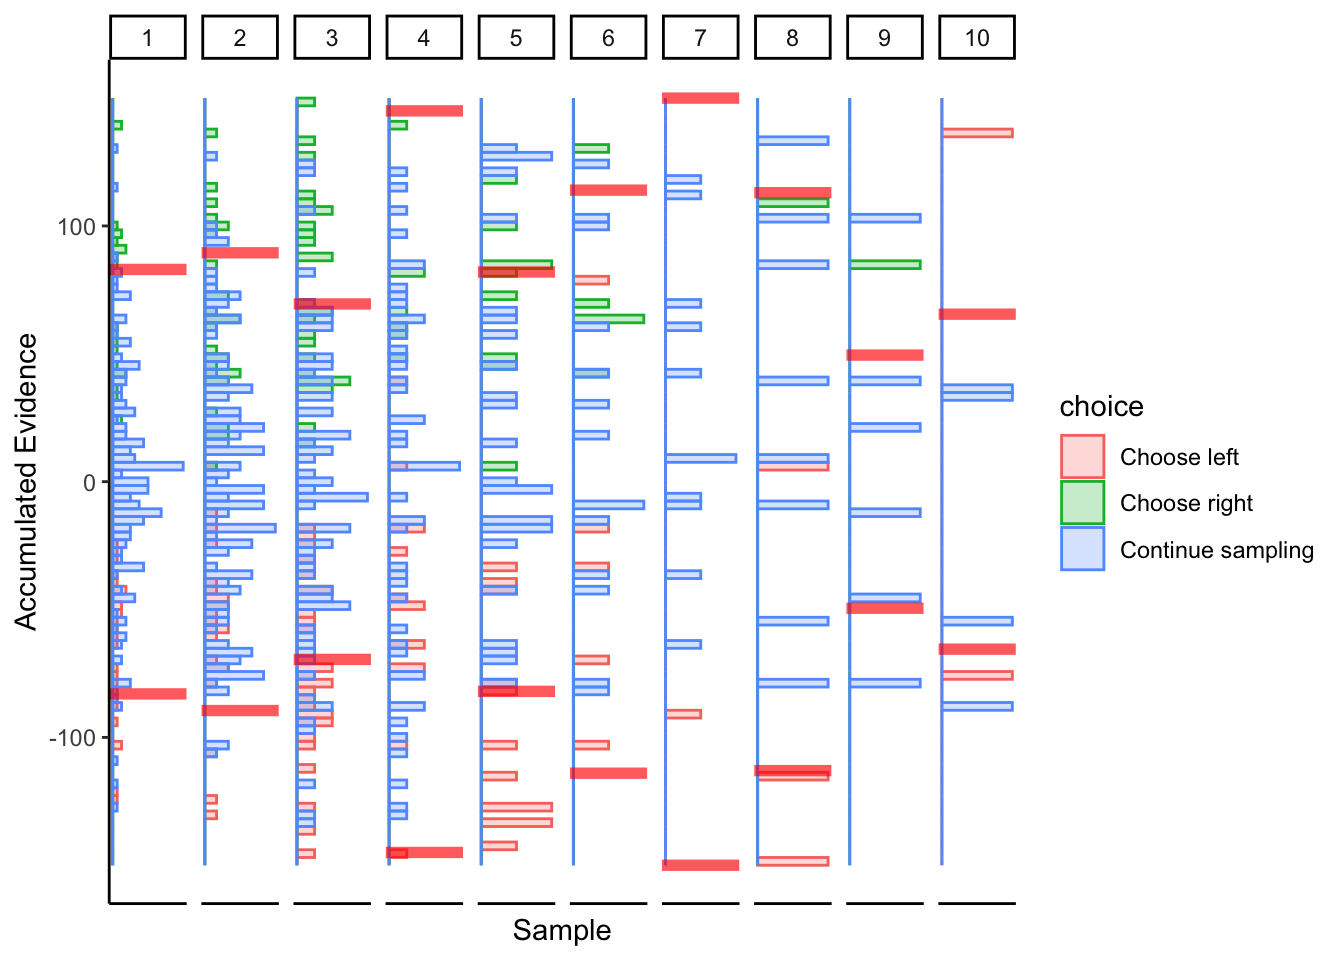
Subject 1
## ERROR : infinite or missing values in 'x'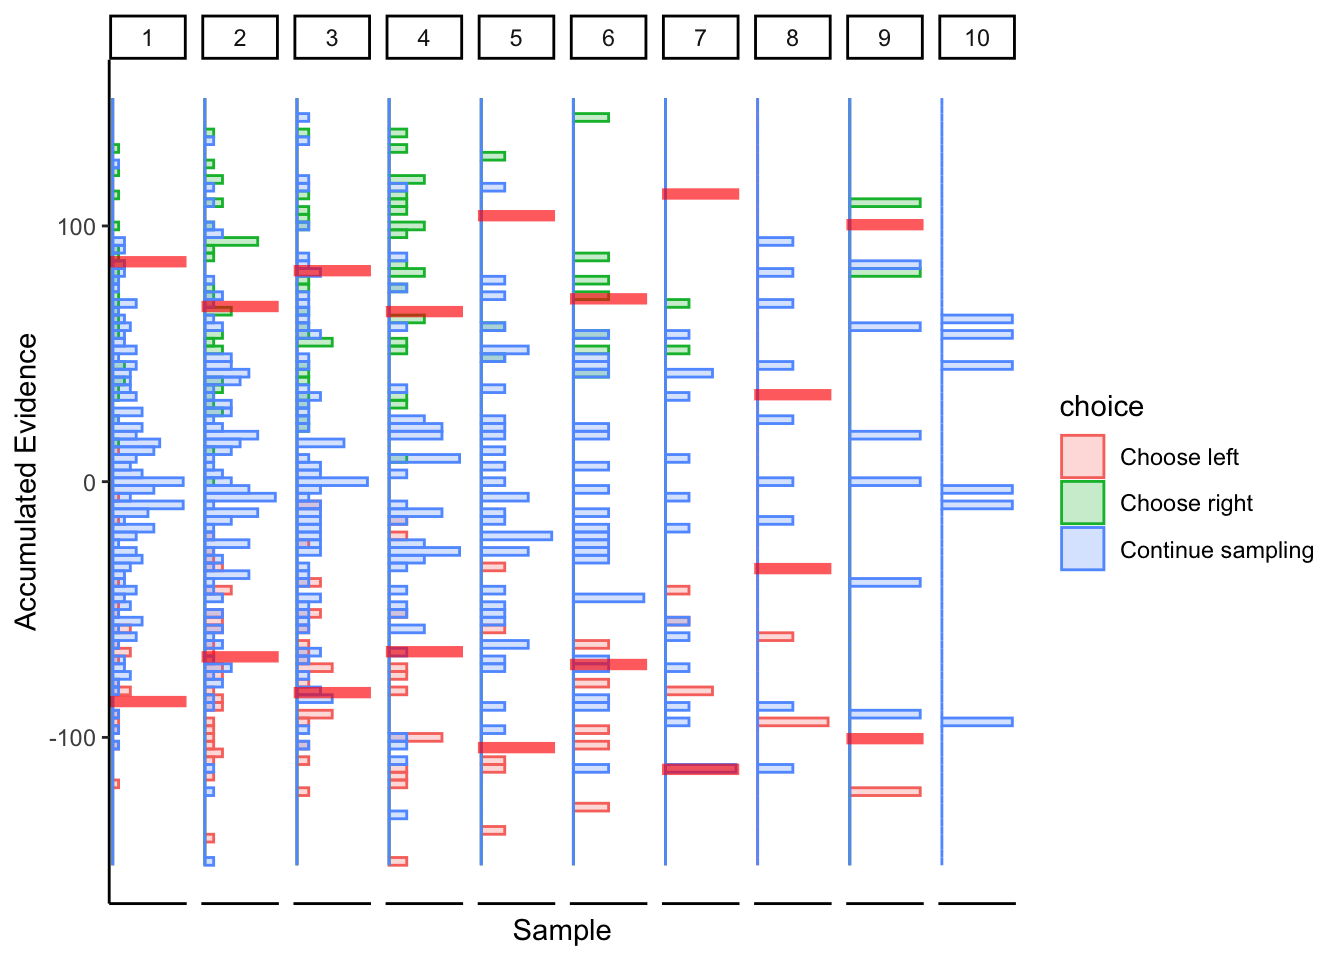
Not great… maybe this was just a fluke. If we consider the timepoints with the bulk of observations, then maybe we could argue evidence in favor of fixed bounds.


2.3 Perceptual data, slider
Instead of calculating accumulated evidence using a linear accumulator, I substitute it with slider bar location. Just curious if this works.
2.3.2 DCB
Subject 1
## ERROR : infinite or missing values in 'x'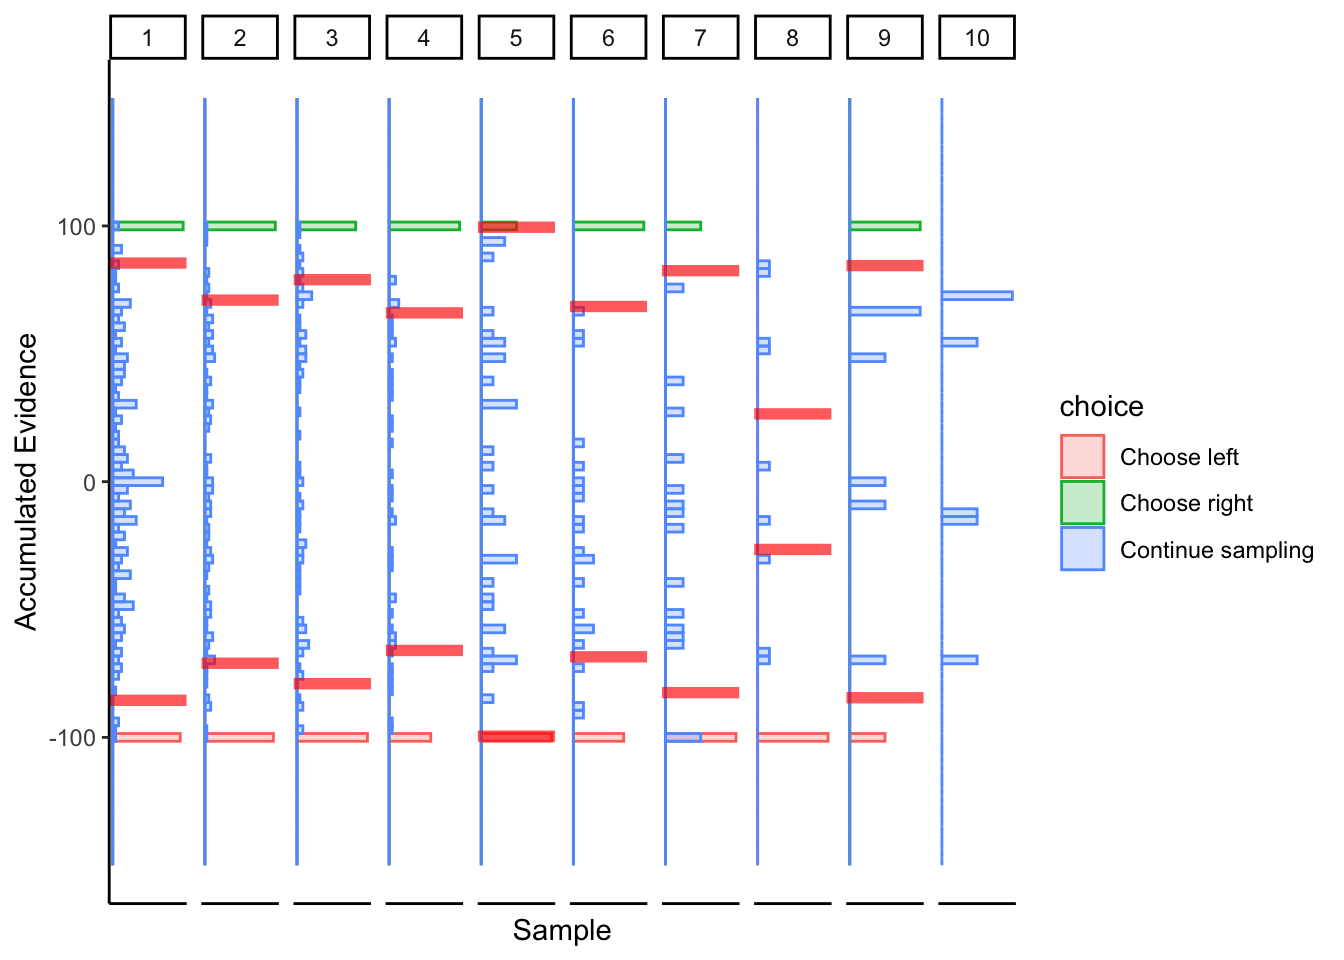
More linear boundaries, but that’s because the maximum / minimum slider bar location is 0 / 100, so this approach is naturally biased towards a linear boundary.
Subject 2
## ERROR : variable 1 appears to be constant within groups
## ERROR : missing value where TRUE/FALSE needed
## ERROR : non-conformable arrays
## ERROR : non-conformable arrays
## ERROR : non-conformable arrays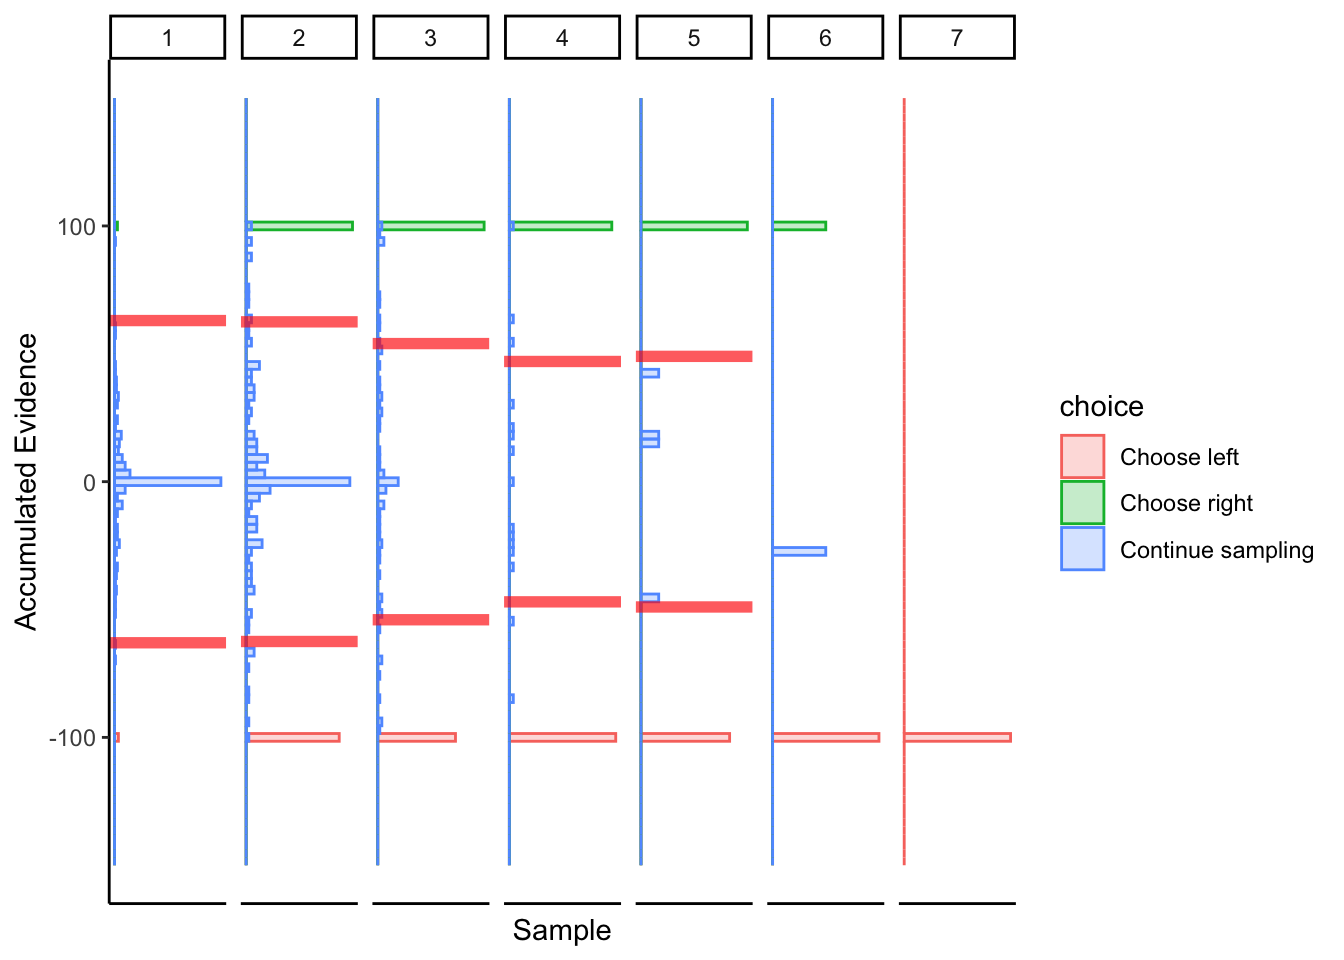
Subtle hints of collapsing barrier, again biased towards a linear boundary.
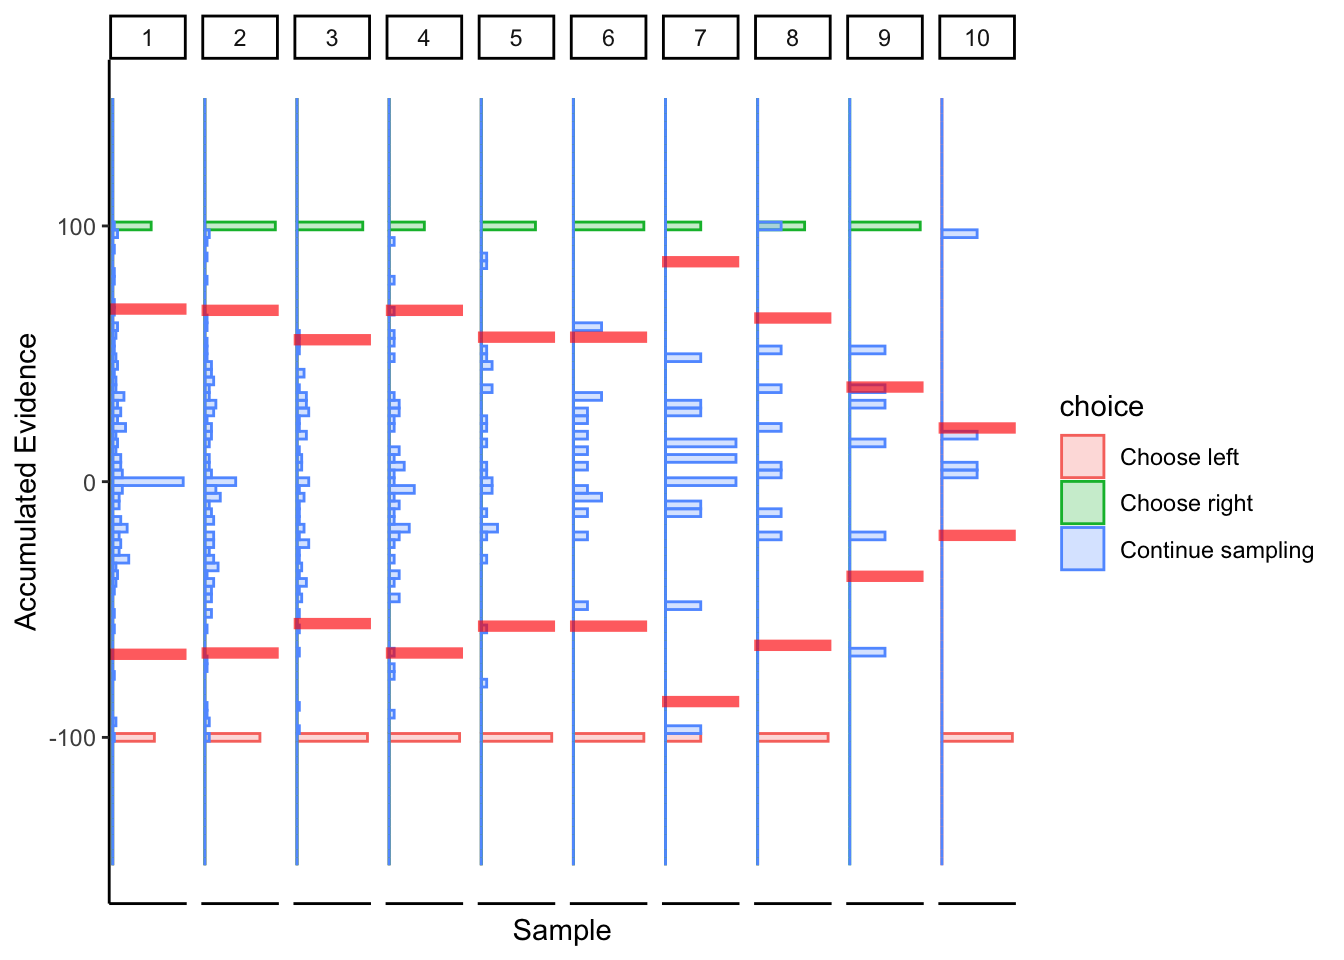
Conclusion
The fact that the “accumulated evidence” for choices cannot differ from \(\pm 100\) biases the collapsing boundary towards linear bounds. There is still some hint of collapse for the subjects who previously displayed collapsing boundaries, but I’m not sure we can call this a success. That’s ok, I took a shot in the dark asking if the algorithm could work with just slider bar locations, and it turns out that it probably doesn’t.
2.4 Value-based data, DDM
I use data from (Eum, Dolbier, and Rangel 2022) visible trials. The data can be downloaded here: https://www.rnl.caltech.edu/publications/index.html. I am not assuming a drift diffusion model for accumulated evidence. I am simply assuming a linear accumulator (drift=1). If the DCB exhibit a bias that is linear in samples, then perhaps performance can be improved by using subject-specific drift rate parameters. However, if the DCB exhibit non-linear bias, then I find it hard to believe that drift rate will make much difference.
2.4.1 Prep work
Take subj data, output figure
Let’s assume one sample occurs every 250 ms. This splits the time dimension into roughly the same resolution as the simulations above.
plotDCB <- function(data, maxSamples=10) {
# Get subject's data and convert it to useable input to our DCB() function.
# Requires sample, choice, ae, and trial variables in time-series panel format.
subj.data <- data
subj.data$samples <- (round(subj.data$RT/.25)*.25) /.25 #250m
subj.data$trial <- c(1:length(subj.data$RT))
subj.data <- subj.data[rep(seq(nrow(subj.data)), subj.data$samples),] #repeat each row by number of samples
subj.data <- subj.data %>%
group_by(trial) %>%
mutate(ae=cumsum(condition),
sample=row_number())
subj.data$choice <- subj.data$response
subj.data[subj.data$sample!=subj.data$samples,'choice'] <- 2
subj.data <- subj.data[,c('sample','choice','ae','trial')]
# DCB
subj.dcb <- DCB(subj.data, maxSamples)
subj.dcb
tempData <- subj.data
tempData$choice <- factor(tempData$choice, levels=c(0,1,2), labels=c('Choose right','Choose left','Continue sampling'))
tempData <- merge(tempData,subj.dcb[,c('sample','avgb')], by.x="sample", by.y="sample")
p <- tempData[tempData$sample<=maxSamples,] %>%
ggplot(aes(x=ae, fill=choice, color=choice)) +
geom_histogram(alpha=.5, bins=50, position='identity') +
geom_vline(aes(xintercept=avgb), color='red', alpha=.5, size=2) +
geom_vline(aes(xintercept=-avgb), color='red', alpha=.5, size=2) +
coord_flip() +
theme_classic() +
labs(x='Accumulated Evidence', y='Sample (250 ms)') +
xlim(c(-50,50)) +
theme(
plot.title = element_text(size=22),
axis.ticks.x = element_blank(),
axis.text.x = element_blank()
) +
facet_grid(~sample, scales="free")
return(p)
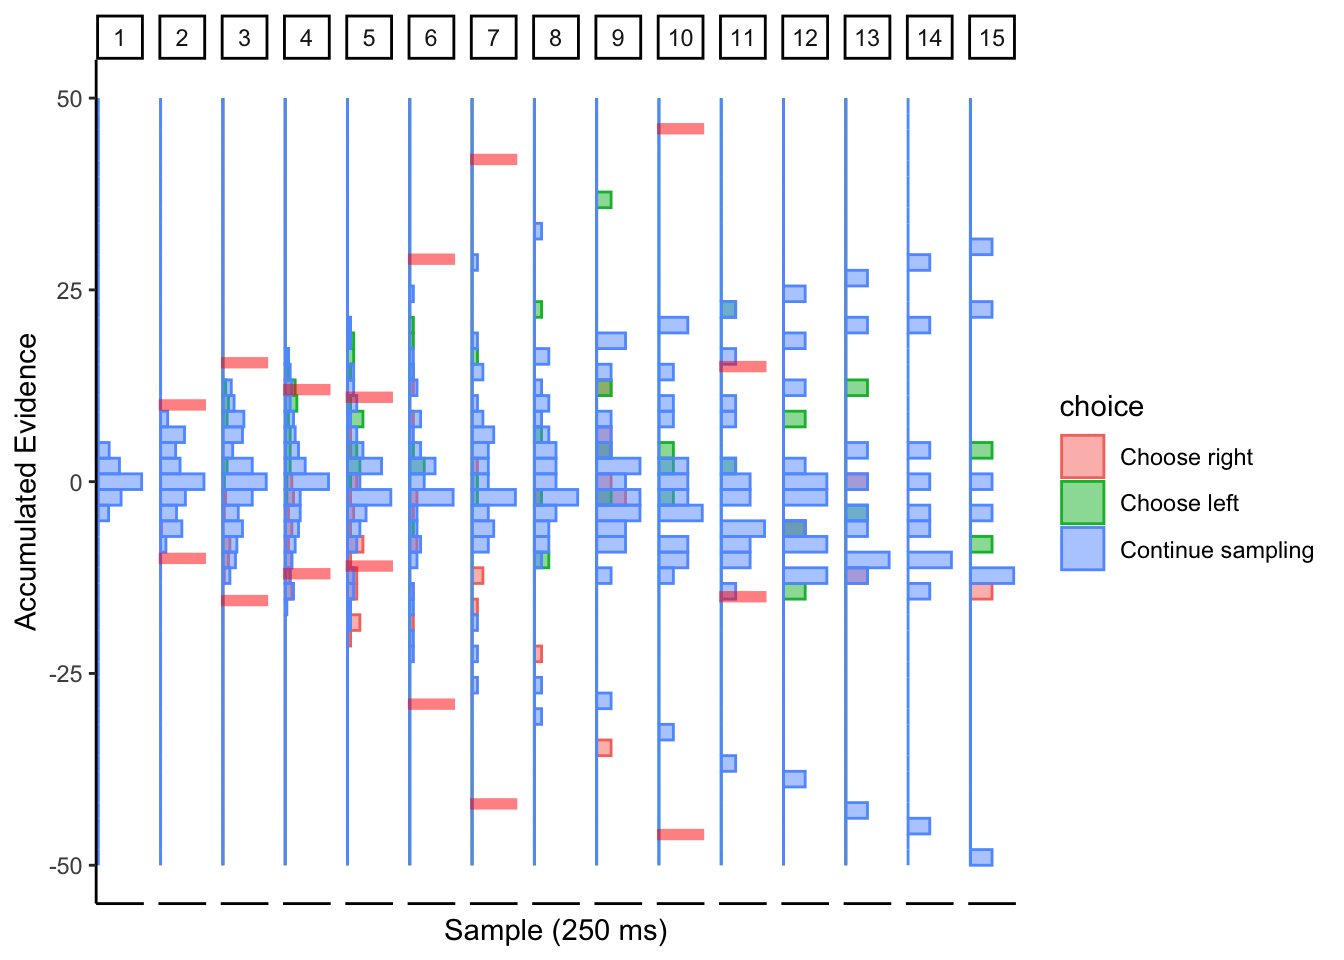
}2.4.2 DCB
Subj 225
## ERROR : infinite or missing values in 'x'
## ERROR : infinite or missing values in 'x'
## ERROR : infinite or missing values in 'x'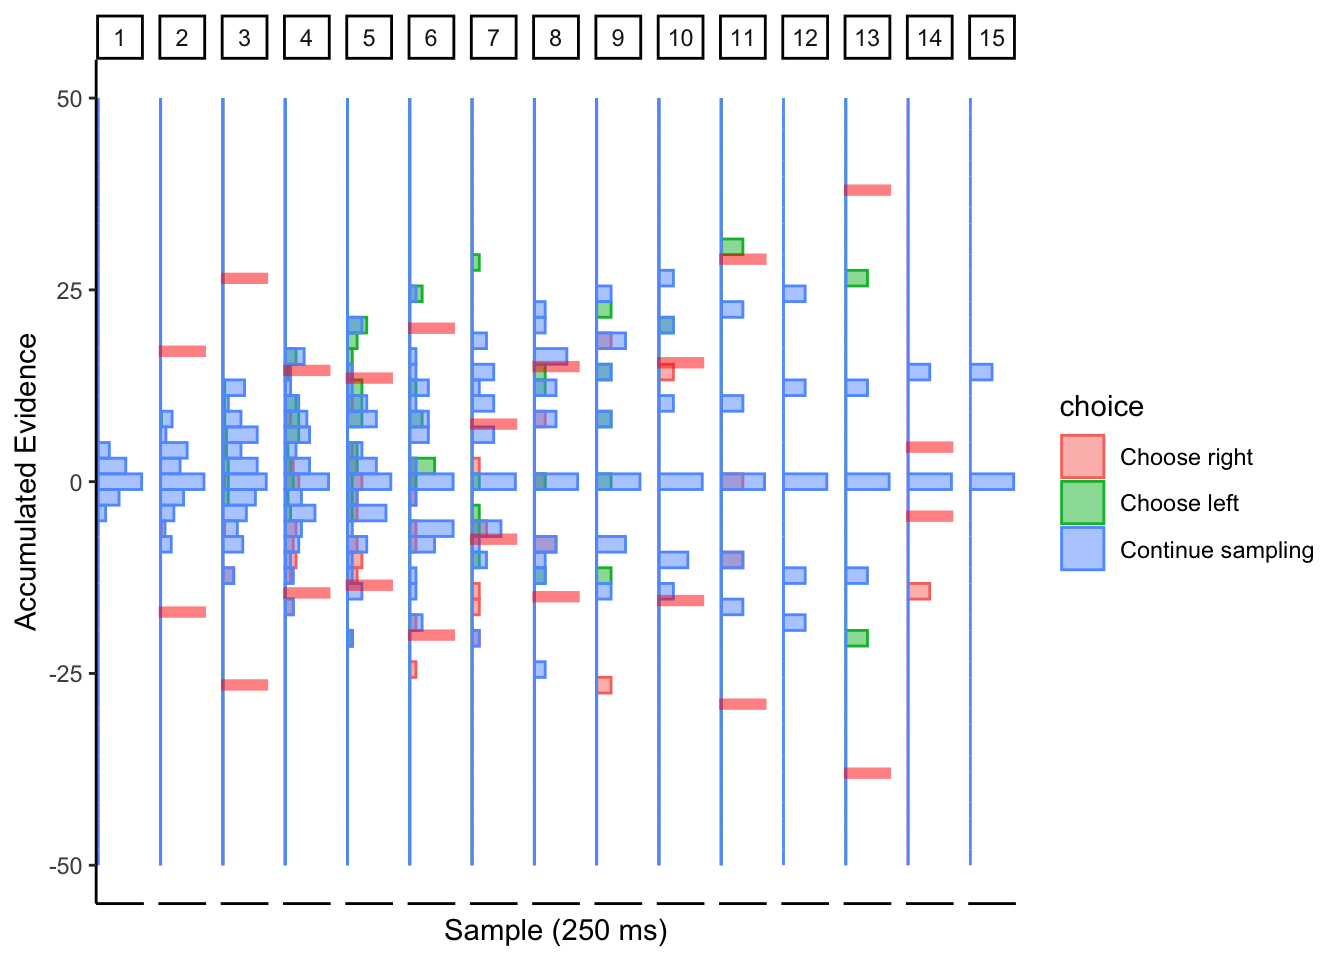
Perhaps collapsing boundary with large noise? This conclusion is based on the simulations of the collapsing cyborg with a large noise parameter.
Subj 304
## ERROR : infinite or missing values in 'x'
## ERROR : infinite or missing values in 'x'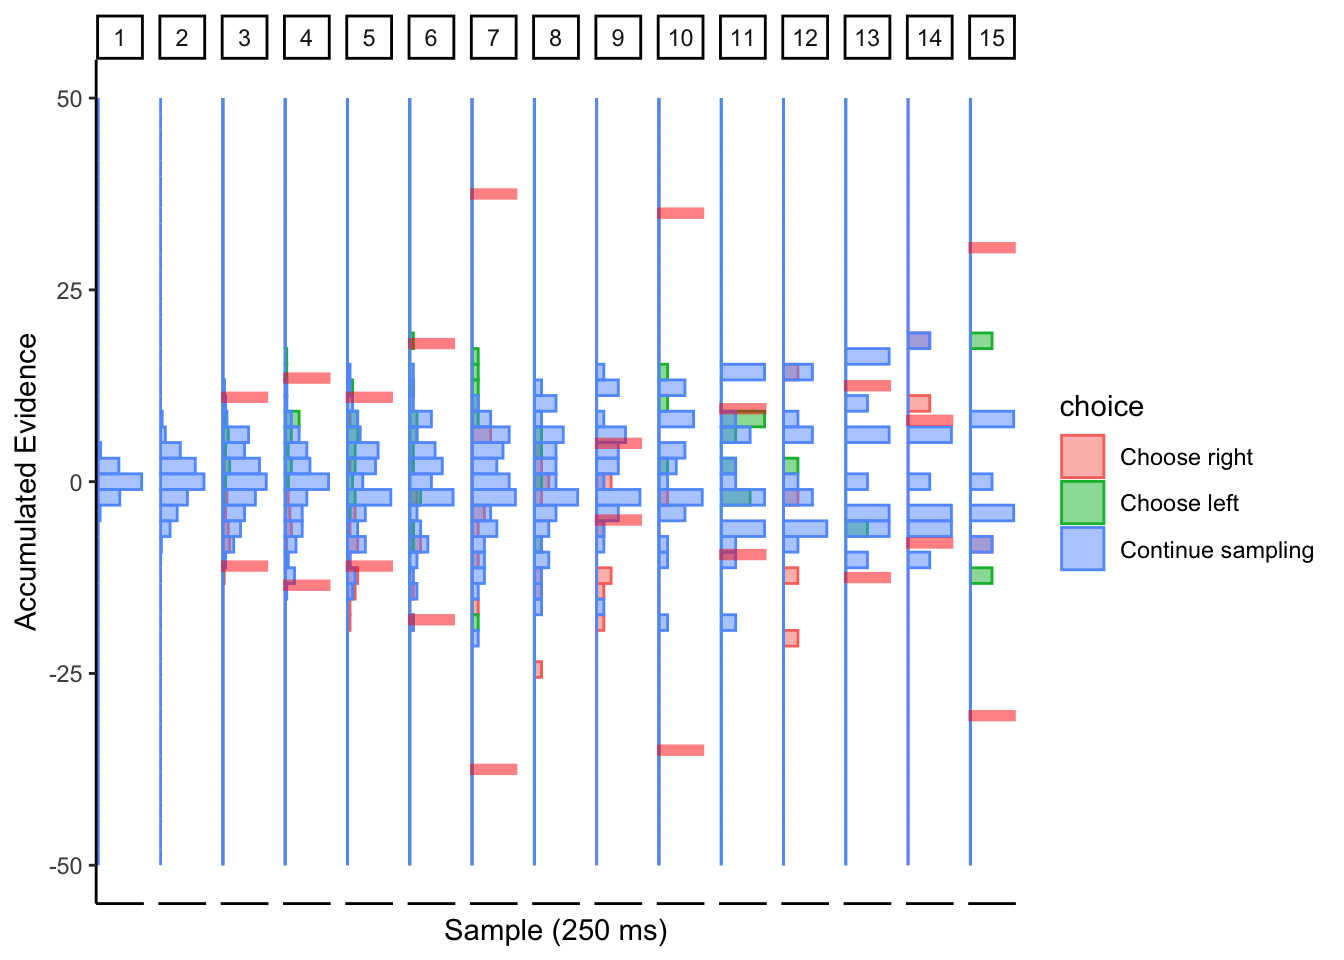
Not sure what to make of this.
2.4.3 Conclusion
DCB is not looking promising in the value-based choice domain. Of course, I don’t know what subjects’ actual collapsing bounds are, but my attempt at fitting the DCB either suggests there is too much noise in the process for DCB to be effective. Perhaps value signals are too noisy compared to perceptual or numerosity stimuli. Also, the rate of evidence accumulation in these cases is constant since they are staring at the same stimuli for the entirety of the decision making process. I don’t think the DCB was intended to be used on stimuli like this, so it’s like trying to use a fork to drink soup.
2.5 Value-based data, aDDM
Now, let’s see what happens if we calculate accumulated evidence with the aDDM (without noise). I have a hunch that this might work better!
2.5.1 Prep work
Read data
We want to take the choice-fixations data and transform it into an object that we can feed into plotDCB() below.
Ideally, the output should have: * subject * trial * a time dimension * accumulated evidence (at that point in time) * choice
We also need subject-speccific aDDM estimates.
# Choice-fixation data
load("data/dcb-cf.R")
ddm.data <- data.frame(
subject=cf$parcode,
trial=cf$trial,
hidden=cf$hidden,
vl=cf$avgWTP_left,
vr=cf$avgWTP_right,
loc=cf$location,
dur=cf$duration,
choice=cf$choice,
rt=cf$rt/1000
)
ddm.data <- ddm.data[ddm.data$hidden==0,] #keep visible trials
# Subject-level aDDM estimates
subs <- unique(ddm.data$subject)
selected.subs <- c(225,304,316,319) #Pick 4 subjects
selected.subs.ind <- c(25,28,38,41) #indexes
ddm.estim <- read.csv("data/dcb-MAP_estimates.csv")
# Transform data
ddm.data <- ddm.data[which(ddm.data$subject %in% selected.subs),]
ddm.data$evidence <- NA
for (i in c(1:length(selected.subs))) {
# looking nowhere
ind <- (ddm.data$subject==selected.subs[i] & (ddm.data$loc==0 | ddm.data$loc==4) )
ddm.data[ind,'evidence'] <- 0
# looking right
ind <- (ddm.data$subject==selected.subs[i] & ddm.data$loc==2)
ddm.data[ind,'evidence'] <- ddm.estim$d_v[selected.subs.ind[i]] *
(ddm.estim$t_v[selected.subs.ind[i]]*ddm.data[ind,'vl'] - ddm.data[ind,'vr'])
# looking left
ind <- (ddm.data$subject==selected.subs[i] & ddm.data$loc==1)
ddm.data[ind,'evidence'] <- ddm.estim$d_v[selected.subs.ind[i]] *
(ddm.data[ind,'vl'] - ddm.estim$t_v[selected.subs.ind[i]]*ddm.data[ind,'vr'])
}
ddm.data <- ddm.data[rep(seq(nrow(ddm.data)), ddm.data$dur),] #repeat each row by number of samples
ddm.data <- ddm.data %>%
group_by(subject,trial) %>%
mutate(ae=cumsum(evidence),
time=row_number())Take subj data, output figure
Let’s assume one sample occurs every 250 ms. This splits the time dimension into roughly the same resolution as the simulations above.
This overwrites the previous function so that we can calculate accumulated evidence (ae) using the aDDM instead of a linear accumulator.
plotDCB <- function(data, maxSamples=10) {
# Get subject's data and convert it to useable input to our DCB() function.
# Requires sample, choice, ae, and trial variables in time-series panel format.
data$time <- ceiling(data$time / 250) * 250 #round up times to the nearest 250 above.
subj.data <- data %>%
group_by(subject,trial,time) %>%
summarize(
sample=last(time)/250,
choice=last(choice),
ae=last(ae)
) %>%
ungroup() %>%
group_by(subject,trial) %>%
mutate(
samples=max(sample)
)
subj.data[subj.data$sample!=subj.data$samples,'choice'] <- 2
# DCB
subj.dcb <- DCB(subj.data, maxSamples)
subj.dcb
tempData <- subj.data
tempData$choice <- factor(tempData$choice, levels=c(0,1,2), labels=c('Choose right','Choose left','Continue sampling'))
tempData <- merge(tempData,subj.dcb[,c('sample','avgb')], by.x="sample", by.y="sample")
p <- tempData[tempData$sample<=maxSamples,] %>%
ggplot(aes(x=ae, fill=choice, color=choice)) +
geom_histogram(alpha=.5, bins=25, position='identity') +
geom_vline(aes(xintercept=avgb), color='red', alpha=.5, size=2) +
geom_vline(aes(xintercept=-avgb), color='red', alpha=.5, size=2) +
coord_flip() +
theme_classic() +
labs(x='Accumulated Evidence', y='Sample (250 ms)') +
xlim(c(-25,25)) +
theme(
plot.title = element_text(size=22),
axis.ticks.x = element_blank(),
axis.text.x = element_blank()
) +
facet_grid(~sample, scales="free")
return(p)
}2.5.2 DCB
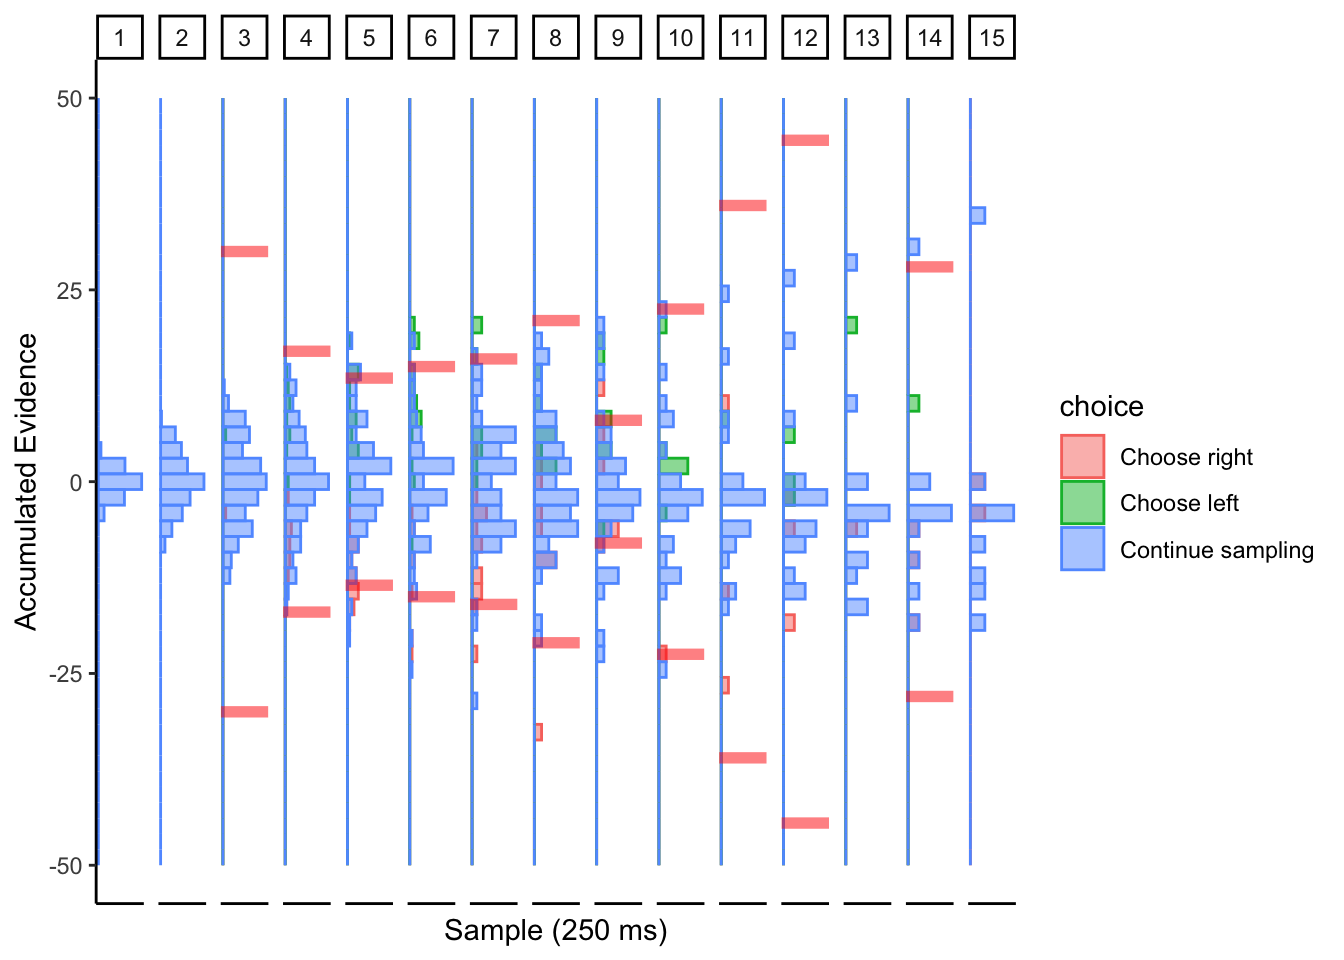
Subj 225
## ERROR : infinite or missing values in 'x'
## ERROR : infinite or missing values in 'x'
## ERROR : infinite or missing values in 'x'
## ERROR : infinite or missing values in 'x'
Confusion…
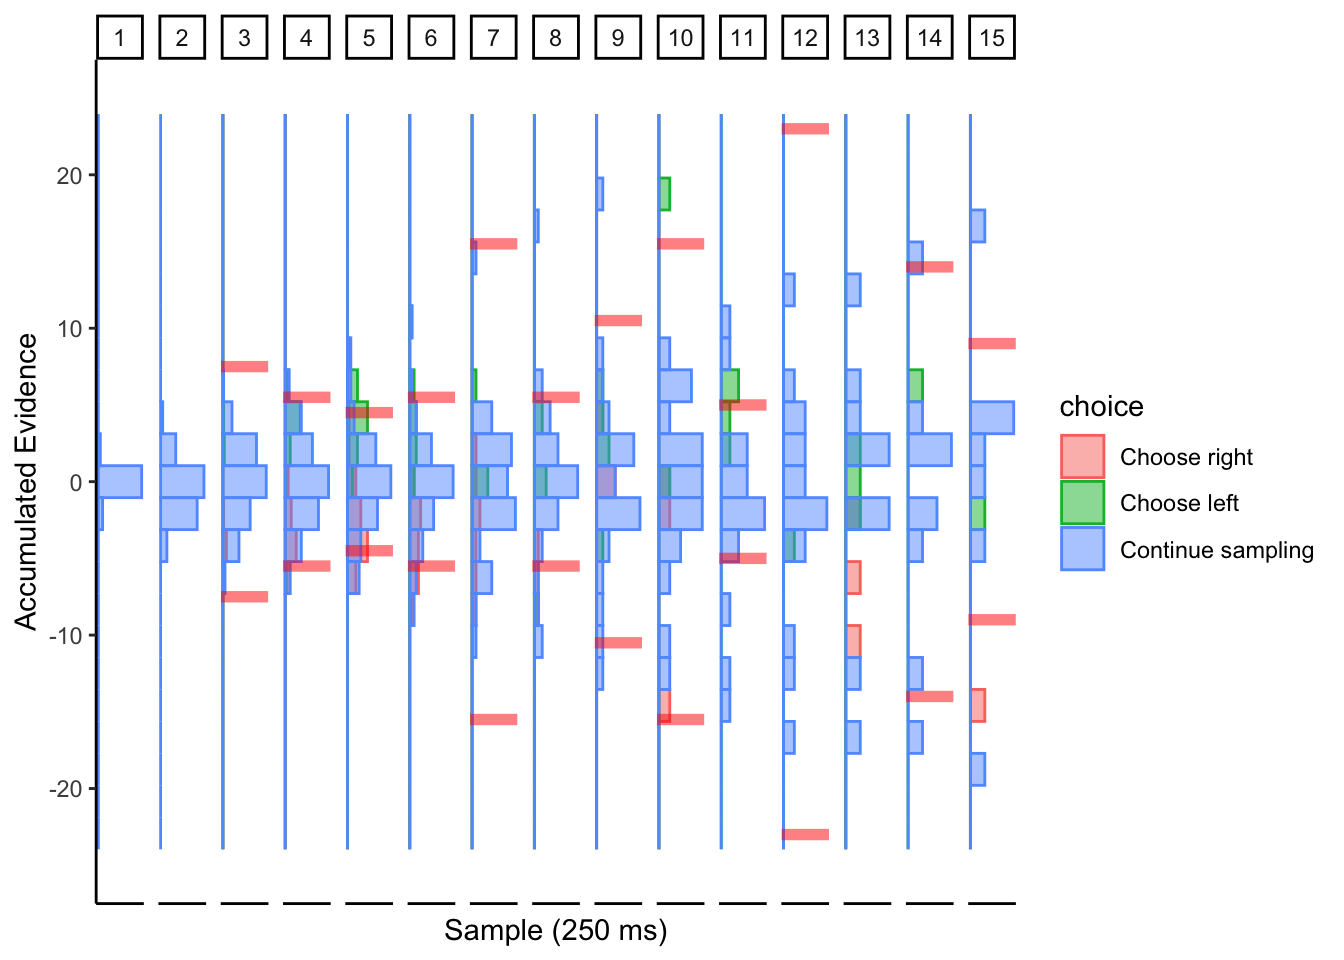
Subj 304
## ERROR : infinite or missing values in 'x'
## ERROR : infinite or missing values in 'x'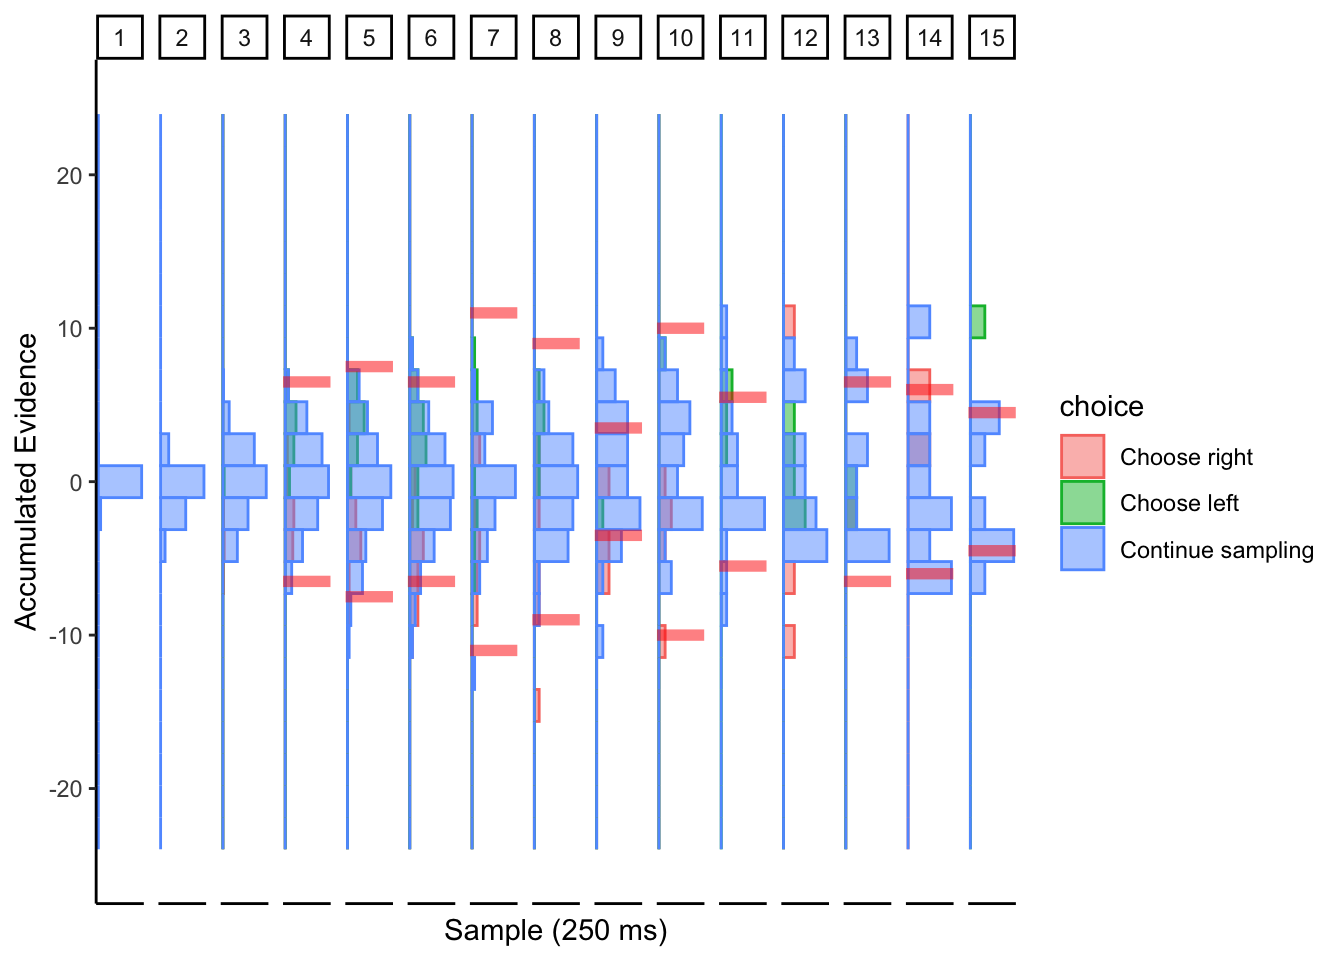
Looks like collapsing bounds with large noise?

2.5.3 Conclusion
I’m not sure the DCB’s make any sense here, but if we were to interpret them, then subjects mostly seem like they have collapsing bounds with large noise. This might make sense if we believe that value signals are noisier than perceptual or numerosity stimuli, but that also makes DCB a poor candidate algorithm for fitting decision bounds to value-based behavioral data.
2.6 Discussion
Overall, the DCB seems to show some promise with perceptual data, but not with value-based data. This is by no fault of the DCB, I was just curious if it would work in the value-based domain (like a baby trying to drink soup with a fork).
For perceptual data, I think it works particularly well on subjects who are very impatient (both of the collapsing bound subjects in the perceptual data mentioned that they were getting very impatient with the task). Aside from those subjects, it seems to estimate boundaries that appear very volatile over time. I’m not really sure what to make of those results, and the extreme volatility does not leave much room for interpretation.
Personally, I think that although the DCB could be estimating decision boundaries more accurately, we lose the interpretability that comes with using a functional form for collapsing bounds. At the end of the day, isn’t that the purpose of a simplified model of decision making?
Furthermore, if subjects aren’t arriving at all possible choices early on in the trial, the DCB fails to estimate boundaries. This prevents us from estimating the starting point of the decision boundaries.