Chapter 9 Single Agent Simulations
9.1 Single Agent
Take a single DDM agent with default parameters. What is the rate at which they violate FOSD?
single_agent = data.frame()
evidence = pdata$L_ev - pdata$R_ev
for (i in 1:length(evidence)) {
  single_trial = simulate_ddm(evidence[i]) %>% data.frame()
  single_trial$evidence = evidence[i]
  single_agent = bind_rows(single_agent, single_trial)
}

# Some cleaning
single_agent$rnd_evid = single_agent$evidence %>% round()
single_agent$error = ifelse(single_agent$choice==1, 0, 1)
9.2 Expected Value Differences and Error Rate
pdata.error_ev = single_agent %>%
  group_by(rnd_evid) %>%
  summarize(error = mean(error))

ggplot(pdata.error_ev, aes(x=rnd_evid, y=error)) +
  geom_line(size = 2) +
  theme_bw() +
  labs(y = "Rate of Violations of FOSD", x = "Rounded Expected Value Difference (L-R)") +
  coord_cartesian(ylim=c(0,1))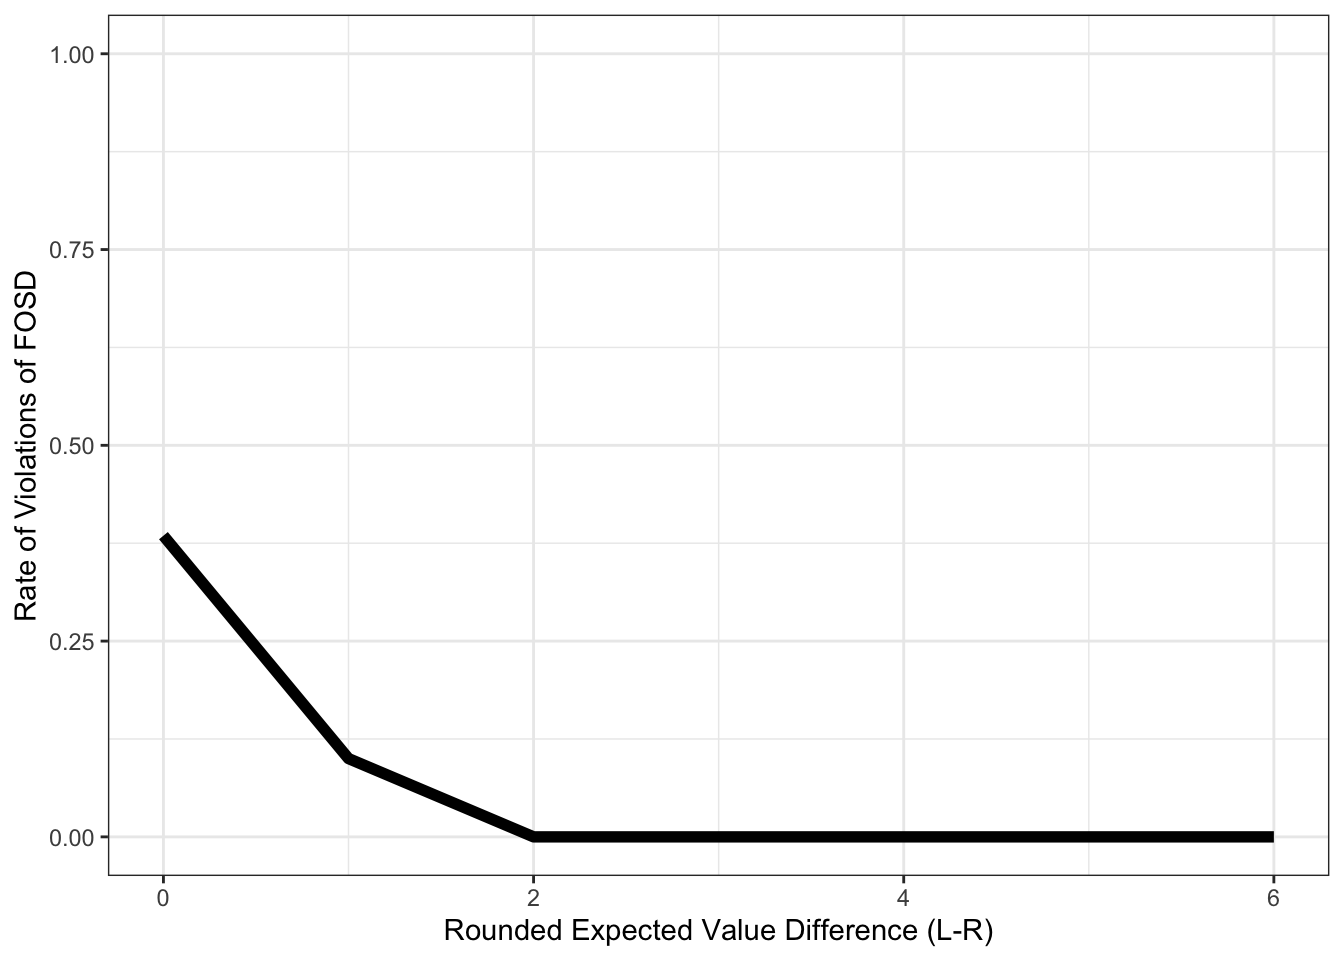
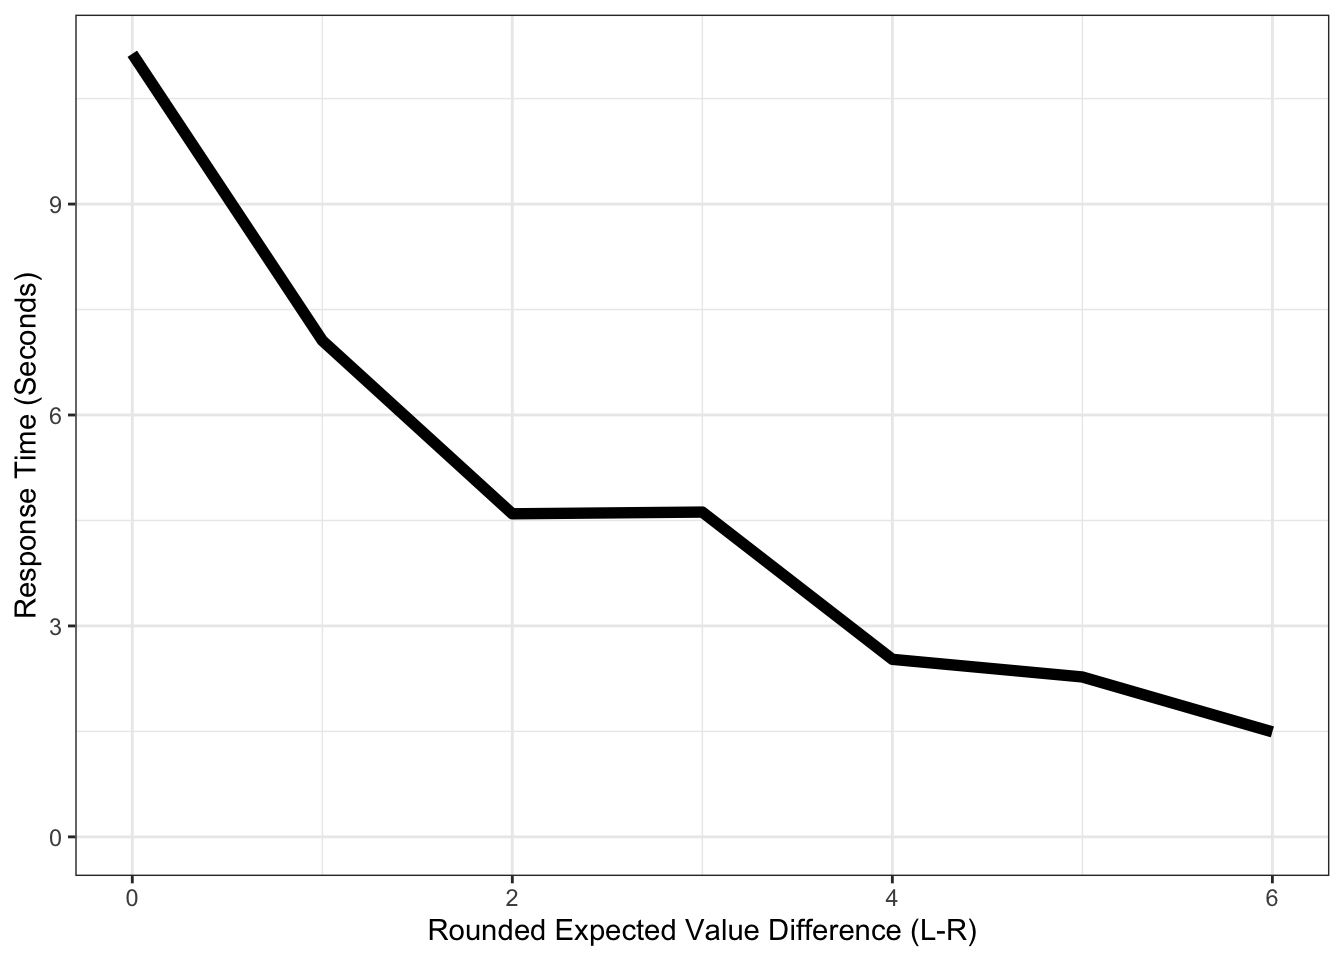
9.3 Response Times and Value Differences.
It’s well established in the literature that response times will increase as Expected Value Differences go to 0 (see Forstmann et al. 2016 for a great review). This is typically replicated in every dataset that wants to explain data with DDM since it’s so robust. Think of it as a sanity check that the model can be applied to this data.
pdata.rt_ev = single_agent %>%
  group_by(rnd_evid) %>%
  summarize(rt = mean(rt)/1000)

ggplot(pdata.rt_ev, aes(x=rnd_evid, y=rt)) +
  geom_line(size = 2) +
  theme_bw() +
  labs(y = "Response Time (Seconds)", x = "Rounded Expected Value Difference (L-R)") +
  coord_cartesian(ylim=c(0,NA))